Re: accounting for the 1715 fleet vessels by their own " offical records"
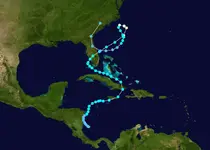
Goldminer49 quoted a passage to me from Mila's hurricane book for an event in 1715. While Spanish authorities in Havana and elsewhere said nothing about it, seems there was a storm that passed across Hispaniola at the appropriate time, northbound. Now, not much was said, if anything, in Freeport, about this event, but, I have constructed a graphic model (I love playing with my crayons!) that takes the storm north from Hispaniola and round-house punches the Florida coast after grazing the northnern Bahama bank. This would be in keeping with Bill Moore's contention that the storm was 'south' trending. Its an unusual circumstance that might be recalled from Katrina who passed across the peninsula farther south in a similar south-trending arc before curving north toward the Mississippi delta.

GOHO states that his observations of the 1715 wrecks would indicate a U shaped dispersal. This would seem to hold true for the Cabin wreck and for the Nieves (Douglas Beach if you prefer to argue the real identity) if you look at the mapping produced by Carl Clausen and Lou Ullian in "Pieces Of Eight". I don't have much experience with the Nieves, but I do have some with the Cabin wreck site, so, just for chuckles, I have some pretty decent rectified comparisons that support GOHO's observations... to a point. The next illustration is an aerial of the Cabin site shot in 1967, a year before I actually got to work there. The photo is important because the buildings, as they are located in this photo, can be used to inverse the bearing shots that State inspectors made while working on the Real 8 boats.

The next illustration is a rectified scan of the Clausen-Ullian map published in 1966. I would have to think that most of this material was evident to the eye without excavation, per se, for the most part. This was before anybody else actually got to dig there (well, yes, there was a hard-hatter from Fort Pierce that took his shot early on, and who knows what McKee may have done there, but, I stand un-corrected at the moment). The rectification was done using the previous photo along with some other DEP setback monumentation with all of the samples cast in State Plane coordinates, NAD83, Zone 901, Survey Feet.

I've overlaid the Clausen-Ullian map with transparency on the photo to support the fidelity of the map in this next illustration. U shaped might be better described as a 'checkmark'. Don't laugh: this discrimination may lead to a pot of gold!

The Fishers provide their contractors with data in the form of plots for each of the sites under their control. These plots are generally on E size paper, in color, with a key and sexigesimal degree grid overlay. They are invaluable. But, one must remember that some of the data may be questionable... after all, the State quit providing data-recorders many years ago, and there are any number of reasons why contractors may fail to accurately report their fixes. None-the-less, these plots provide us with some invigorating evidence which both supports the U shape dispersal theory, along with evidence that there may be more to consider. If you have never seen one of these plots, here's one for the Cabin wreck that I scanned and rectified to match my mapping software so that I can put our blowers where nobody has previously dug (supposedly). The pink circles represent holes dug that produced nothing. The blue holes represent holes that produced silver. There are numerous other items that are color coded, and there are alpha-numeric markers in the circles which you can not see at this scale. Obviously there was silver found all over the place. The grids each represent a square of about 64 feet on a side with each tick measuring about 6.4 feet. The average circle symbol is about 18 feet across at this scale.

I took the Fisher chart and laid it over the Clausen-Ullian map to produce the next semi-transparent illustration.

Previously, I wrote that I thought the storm was very large and I still think that it re-organized over the Bahamas and really built a huge circulation. In my first illustration the eyewall is about 112 miles in diameter. As the center of circulation approached the fleet, as seen in the next illustration, the northern-most vessels were driven ashore in a shorter period of time, while the souther-most members of the fleet were probably driven to shore on a more exaggerated tangency than those toward the north. It would be hard to illustrate this without resorting to animation. Its important to remember that the winds in the forward-right quadrant of the storm are the firecest (I messed up my explanation of this in my previous post... I was thinking of a north-bound storm at the time, not one on the path I illustrate here).

Moving at 5 miles an hour, it would take about 24 hours to pass the area of Vero as seen in the next illustration. Therefore, if Echeverz was really at the Popa, which I think was probably in the area of south Vero Beach, he would experience a 'second storm' a day after being wrecked. If a ship was below the east-west plane of the storm, it has more of a tendancy, in this model of being swamped further from shore. What does this mean for the vessel supposedly lost below the present-day Hutchinson Island power plant

?

The rear action of the eye-wall is definitely the one of interest! The rear eye-wall did what the forward eye-wall did not do... it spread wreckage back out into water that could support the reduced weight of the shattered timbers, floating bodies, boxes, hull parcels and baggage. This means that we can continue to find more treasure in subsequent explorations. That's why this whole study is worthwhile.


 Which direction did the tons of Gold end up at?