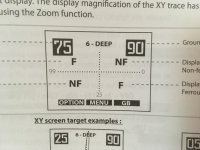
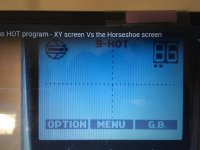
XY Screen question

A little past one minute in this video the dots light up under the Ground Phase number.


Since I'm on this subject, here's another question. There are numbers on the graph axis, the left side "99", right side "0", and "25" at the bottom. Is there any place I can find out about these? Thanks. Second photo is the dots below the "86" ground phase reading.


XY Screen.jpg

dots.jpg
 

Last edited:
Not sure about the XY axis numbers but the three dots under the ground number are the three adjustment points. Each ground number has three adjustments.

Since I'm on this subject, here's another question. There are numbers on the graph axis, the left side "99", right side "0", and "25" at the bottom. Is there any place I can find out about these? Thanks. Second photo is the dots below the "86" ground phase reading.


View attachment 1744970

View attachment 1744971
 

i think you are right. Thanks.
 

Last edited:
The 3 bars do appear to correspond to the ground adjustment points, although what is being displayed is the actual ground phase reading. Go figure.

Andy Sabisch dedicates a few pages in his book on this screen. Ironically, XP in the user manual and Andy in his book label the axis differently. In Andy's book, the horzontal axis is labeled -99 to +99 and the vertical axis simply has a "0" at the top of the vertical axis and no number. Just know that the upper left side is ferrous and is mirrored on the lower right and the upper right side is non-ferrous and mirrored on the lower-left. Strong mixed ferrous will typically give an "unstable" graphic shape (even with a high TID) or a single line going from upper left to lower right, whereas, a pure, round non-ferrous target will give a nice straight line going from lower left to upper right with the length of the line corresponding to signal strength (roughly corresponding to depth and/or mass) and the slope corresponding to the target ID. Higher conductive non-ferrous target ID will have a shallow (more towards horzontal) slope and lower conductive non-ferrous target will have a steeper (more towards vertical) slope. Irregularly shaped non-ferrous like can slaw or bent pull tabs will result in circles or oval shapes in spanning the lower left to upper right quadrants. Andy states that the upper two quadrants are simply mirrored by the their corresponding lower diagonal quadrants. I think the axis labels in the books are basically meaningless. Focus on the shape, slope, and displayed target ID. I have found that once I have gotten used to the Deus audio I get basically the same info as the visual X-Y display so it rarely is of any use to me. Furthermore, it is practically useless in thick target areas where all the various targets tend to jumble up on screen because of the delays associated with display (while the audio has already "moved on" to the next target). The distorted shapes associated with most junk targets come across as distorted audio in the headphones even if the the target ID seems good. Interesting to play with, not very practical in many situations and redundant to the audio tone ID nuances once you have trained your ear IMO. HTH
 

Last edited:
Thanks Hugh. Well I was just curious to see if I had missed something. I use the XY graph now and then. Need to spend more time with it. I think coil control is important to get the most out of it.
 

Thanks Hugh. Well I was just curious to see if I had missed something. I use the XY graph now and then. Need to spend more time with it. I think coil control is important to get the most out of it.

How's it going with the XY screen signal line? I have yet to try it out...
 

Haven't spent much time with it. Haven't had about five hours detecting all Summer. But I do want to learn it a little better.
 

I was using the bottle cap program (XY screen) to check iffy targets in the pull tab range. If the area is not too trashy it was working good for me. If the line is a bit off of perfectly straight you still want to check out. I guess you ought to dig everything until you get a feel for it but most all the bad targets had a screwball graphing.
 

As you become more adept at interpreting the audio, you can actually hear the audio distortions that manifest as the unstable graphics on the XY screen. That is why tge XY screen is redundant to me and I prefer the information provided by the horseshoe graphic related to depth, ferrous probability, and deep whisper targets.
 

I know what you are talking about hearing the distortions. But for me, I don't mind seeing it, too. Remember I'm running this as a cross-check--not the main program, and mostly only on iffy targets. I hope to learn more, and I do appreciate your helpful insight.
 

Lately, I’ve been using the xy screen to sort out coins from trash at the beach. My good finds have doubled since using the xy graphic. Great feature in my opinion. BTW I’ve only been using the HF coils.
 

As you become more adept at interpreting the audio, you can actually hear the audio distortions that manifest as the unstable graphics on the XY screen. That is why tge XY screen is redundant to me and I prefer the information provided by the horseshoe graphic related to depth, ferrous probability, and deep whisper targets.

V, I made the switch to the XY screen 4 or 5 years ago and really liked it. But your post makes me think it is time to mix things up a bit and go back to the horseshoe for a while just to give my Deus designated brain cells a jolt. Both modes have their advantages.
 

Top Member Reactions

Users who are viewing this thread

Back
Top