Hello forum i will show you some test with the mini logger
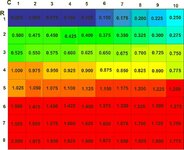
I log every 25 mV from case R1 C1= 0.025V to R8 C1=2.000V Fcy 1000Hz, you can see very well that with the data grid when you have the data1100= 1.500V NOTHING CHANGE ,
so the data mini logger work from 0.000V to 1.500V maximum,
I hope I will have soon my ARC-GEO MINI LOGGER working with more input (will be fine 0.000V to 5.000V because it is the input voltage of the processor ) with the help of Tim Williams creator of the Mini, please Help me!!!
http://lrlman.com/Pages/AG_Mini/AGM.htm
First Image it is the grid color generated by input from 25mV to 2.000V it is the black number in the case witch indicated input
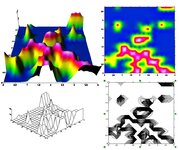
Second image it is the data generated by the minilogger


 now i have no doubt, the minilogger work very well as his because i did not understand the configuration of the input of 10 bits now he explain me thank you Tim , and soon i will post some great pictures of field Test, in attach i show you how i "see some metal copper tube at 1,6 meter underground in my garden and 2 spots of coins at 32cm, i am working now with a great software name Surfer8, a very "must" delight...What i have discovering it is the very powerful use of the minilogger ; it is like a magnifying glass for pi detector.


