63bkpkr
Silver Member
- Aug 9, 2007
- 4,069
- 4,618
- Detector(s) used
- XLT, GMT, 6000D Coinmaster
- Primary Interest:
- All Treasure Hunting
NorCal River Water Flow Rate - Addendum # 2
We've 37 days till summer and at the moment in general the Sierra rivers are running at 25% of normal for this time of year. How low will they be on June 21st? Could be an interesting summer and I sure hope I get a chance to play out there as well. Good Luck Everyone!.......................63bkpkr
During high flood stage the rivers are milk chocolate brown Untamed Beasts! The brown color comes from the tons of dirt the rivers are carrying!!
Ok, next best thing I have to movies are these three charts and they only barely give you an idea of what has happened in the past and what is happening right now.
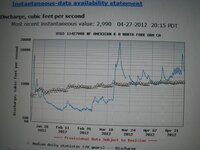 This screen shot shows an about March 15, 2012(last year) with a high of 20,000 cfs.
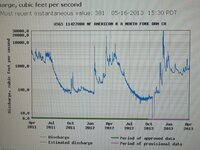
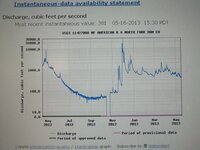
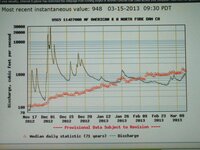 This is a flow chart for late 2012 to early 2013 with a maximum 'showing on the chart of 30,000 cubic feet per second (cfs). This chart and the next chart overlap but are on different scales.
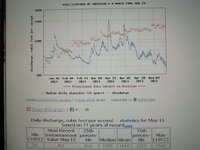 I took this screen shot at 8:45 PM 15 May 2013. It has a high showing of 2000 cfs and right now it is 411 cfs. Also read the historical block at the bottom of the picture as it shows the very lowest recorded data as well as the very highest recorded data. Right now the river should be about 1500 cfs.
So, IF we do not have further storms in the next 36 days or if any that might come through are low water volume storms then as has been indicated a large portion of the summer time stream bed will be exposed. This is actually the reason I posted this thread, Kind of an FYI and for folks to think about.
BUT,that 30,000 cfs storm late last year really moved some hillsides, at least that's my bet from hiking the area since February 1963 when the river was wall to wall, roaring, milk chocolate brown, the boulders were bouncing on the bottom of the river and giant trees were really moving downstream. It was awesome and 'the reason' I fell in love with the place!..................63bkpk
Addendum # 2
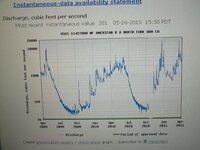
Okay, I've just found the graphing capability has been updated and I'm just a bit excited about it, I'm a cheap date!
Far left chart is 2009-2011, middle chart is 2011-2013 and far right chart is 2012-2013 for a little more detail.
For the past several years the spring highs have been somewhat low but the water levels have been strung out till later in the year. But at the end of 2012 we had an anomaly of 30,000 cfs and now it is looking like our high flow rates are done for this year. With the snow already gone from the Sierras and should no major storms come in the rivers of NorCal will be accessible in a way not seen in some time. This study is flawed in that it only uses the NFAR data however comments in this thread seem to indicate that the river flows further north are also looking to be low flows for the rest of the year. This could be an interesting summer...................63bkpkr
We've 37 days till summer and at the moment in general the Sierra rivers are running at 25% of normal for this time of year. How low will they be on June 21st? Could be an interesting summer and I sure hope I get a chance to play out there as well. Good Luck Everyone!.......................63bkpkr
During high flood stage the rivers are milk chocolate brown Untamed Beasts! The brown color comes from the tons of dirt the rivers are carrying!!
Ok, next best thing I have to movies are these three charts and they only barely give you an idea of what has happened in the past and what is happening right now.
 This screen shot shows an about March 15, 2012(last year) with a high of 20,000 cfs.
 This is a flow chart for late 2012 to early 2013 with a maximum 'showing on the chart of 30,000 cubic feet per second (cfs). This chart and the next chart overlap but are on different scales.
 I took this screen shot at 8:45 PM 15 May 2013. It has a high showing of 2000 cfs and right now it is 411 cfs. Also read the historical block at the bottom of the picture as it shows the very lowest recorded data as well as the very highest recorded data. Right now the river should be about 1500 cfs.
 So, IF we do not have further storms in the next 36 days or if any that might come through are low water volume storms then as has been indicated a large portion of the summer time stream bed will be exposed. This is actually the reason I posted this thread, Kind of an FYI and for folks to think about.
BUT,that 30,000 cfs storm late last year really moved some hillsides, at least that's my bet from hiking the area since February 1963 when the river was wall to wall, roaring, milk chocolate brown, the boulders were bouncing on the bottom of the river and giant trees were really moving downstream. It was awesome and 'the reason' I fell in love with the place!..................63bkpk
Addendum # 2


Okay, I've just found the graphing capability has been updated and I'm just a bit excited about it, I'm a cheap date!
Far left chart is 2009-2011, middle chart is 2011-2013 and far right chart is 2012-2013 for a little more detail.
For the past several years the spring highs have been somewhat low but the water levels have been strung out till later in the year. But at the end of 2012 we had an anomaly of 30,000 cfs and now it is looking like our high flow rates are done for this year. With the snow already gone from the Sierras and should no major storms come in the rivers of NorCal will be accessible in a way not seen in some time. This study is flawed in that it only uses the NFAR data however comments in this thread seem to indicate that the river flows further north are also looking to be low flows for the rest of the year. This could be an interesting summer...................63bkpkr
Amazon Forum Fav 👍
Last edited:


